I often think fondly of Professor Organski, my political science professor. He would stomp up and down the auditorium bellowing, "Math! Math! And more math!" He was one of the fathers of assigning numerical values to scenarios and building models to predict the likelihood of a political event taking place. In the early 1990s, this was a new concept for the principally theoretical world of political science.
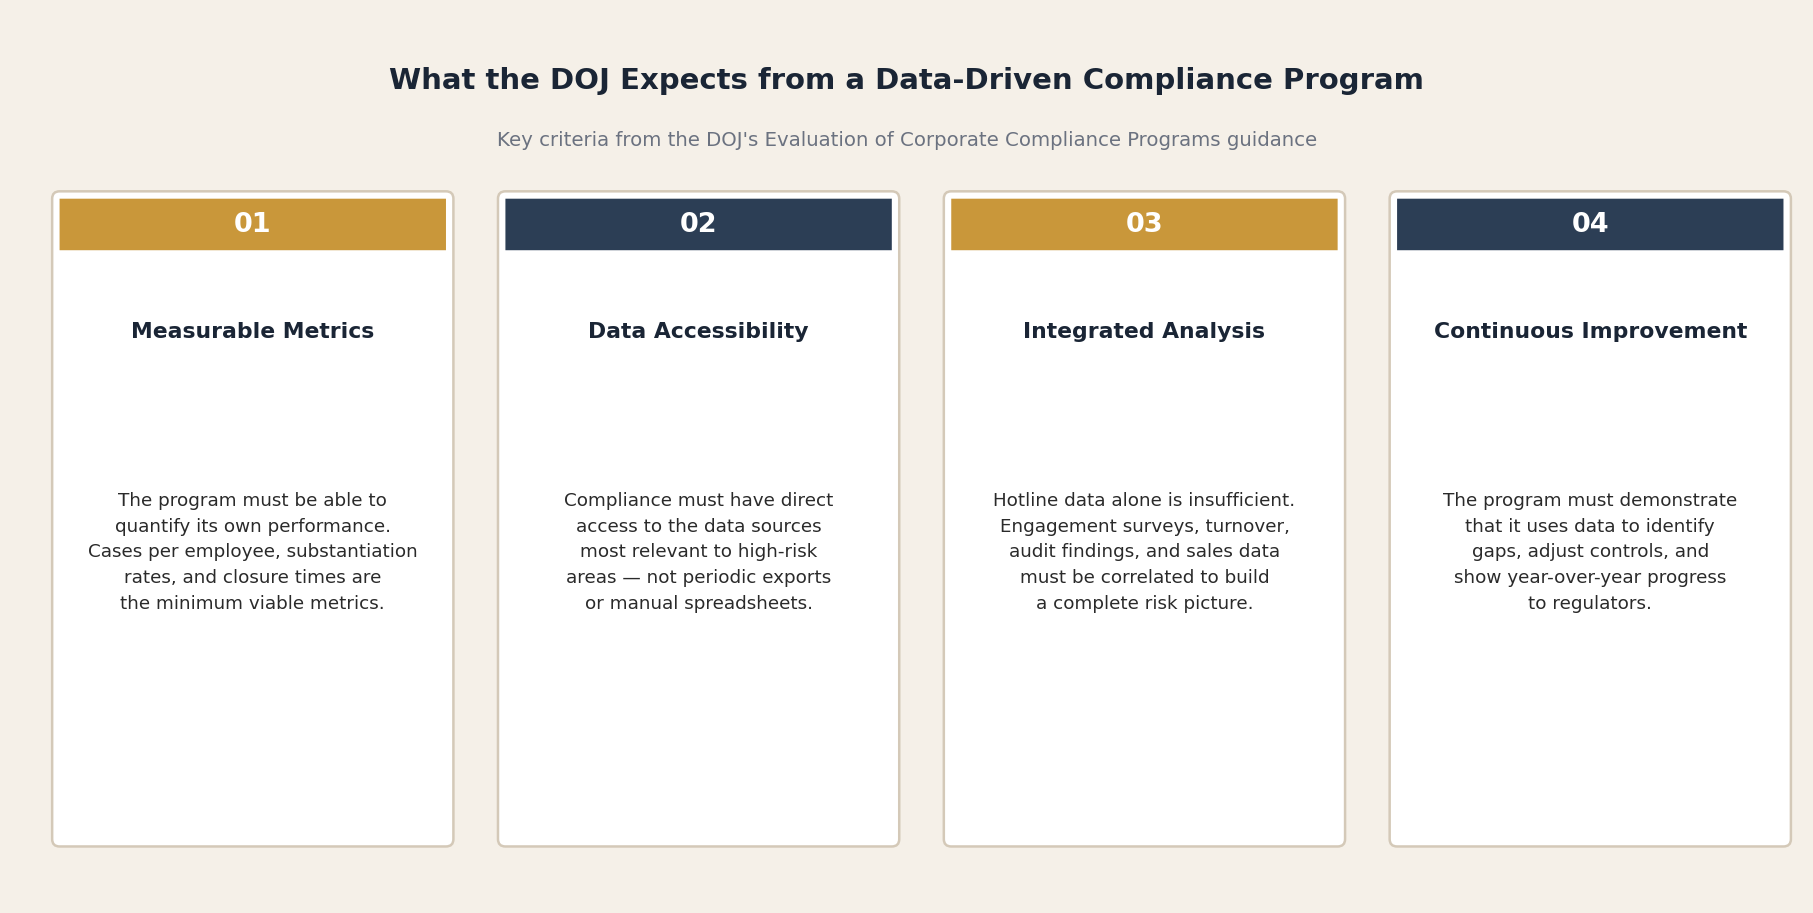
By the same token, companies — and specifically compliance departments — are being asked to tackle both structured and unstructured data and provide insights into how their compliance programs are performing. This trend is further underscored by the DOJ's guidance in its Evaluation of Corporate Compliance Programs.
"Do compliance and control personnel have sufficient direct or indirect access to relevant sources of data to allow for timely and effective monitoring and/or testing of policies, controls and transactions? Do any impediments exist that limit access to relevant sources of data and, if so, what is the company doing to address the impediments?"
— DOJ, Evaluation of Corporate Compliance Programs (2020)Many compliance departments have already gone well beyond an initial foray into utilizing data. But utilizing statistics and predictive analytics is far from the norm. Often this is because the data and math can seem intimidating to implement, or the department lacks the experience or expertise to effectively use the data. This article will focus on one powerful but "low tech" way of getting insights into one of our most important tools — the hotline.
I am going to share a statistical model and show how to interpret the information provided to determine both the health of the hotline as well as insights and possible responses to the data.
I. The First Step
To get started, you need your hotline data — not some of your data, all of your hotline data. Specifically, no matter how an issue from an employee or a third party was reported, it needs to make it to your system. If you only look at the phone calls, you are missing a significant aspect of the data signals that we will be interpreting.
Further, if you have multiple "hotlines" within your company, you need to make a decision. You can either migrate to a single hotline or, behind the scenes, you can integrate all the data into one repository. In my experience, having a single hotline is the way to go, but I also understand that for a variety of reasons this is not always possible.
What should not be held out of the data set are all the "drive by" reporting instances. For example, someone speaks to someone in Legal in the hallway and raises an issue. Before an investigation begins, there should be a formal escalation policy in place to make sure there is transparency and tracking of the matter under review.
This "first step" should not be considered easy or a given, but it is critical. Without all the data, all the insights and takeaways will be skewed.
II. The Metrics System
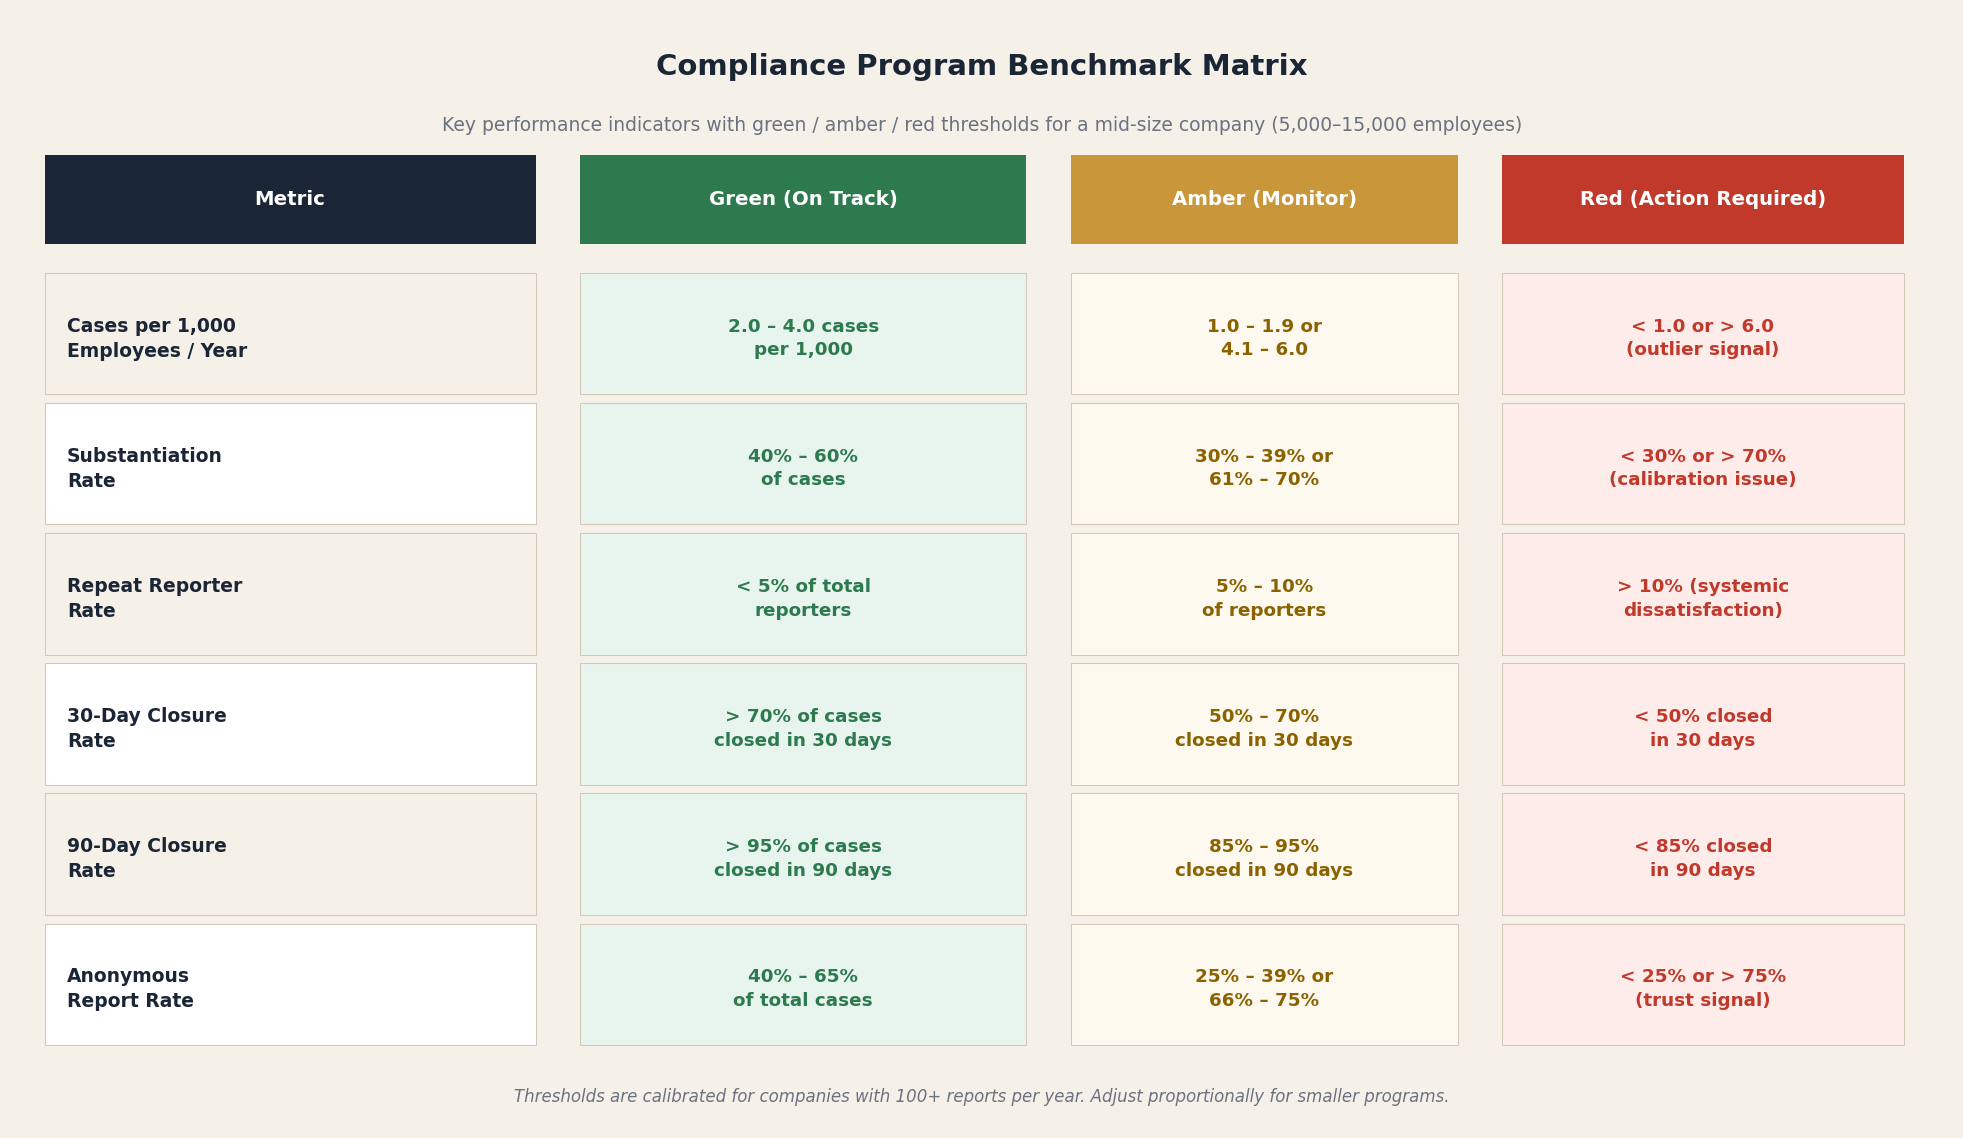
Now that you have all the data, it is a matter of looking at specific attributes. In setting up the table, I recommend that you break it up into quarters. Align it with the fiscal quarters rather than calendar quarters if they are not the same. This is no different than any other performance metric, so this alignment is important.
A. Human Resources
The first metric is HR. For HR, you want your cases to be between 35 percent and 65 percent. The reason for this is that if your HR cases are above 65 percent, then, in essence, you are monitoring a complaint line and you are not getting the compliance data that you really need. On the other hand, you do not want to be below 35 percent, because these HR cases and cadence help "feed" the compliance funnel of cases through use of the system.
For example, a report comes into the system that states, "my manager is coming into work intoxicated." This would be an HR matter; however, in the course of the case, you learn that one of the manager's roles is signing off on regulated records — welcome to compliance!
Many times, people get frustrated with the HR cases "polluting" their hotline. My perspective is that it is virtually impossible to filter them out. The better way to solve this issue is to have good processes that achieve a rapid hand-off to the appropriate HR personnel to handle the matters that are reported.
B. Validity
The second metric is validity. This is a narrow window of 30 percent to 35 percent and is one of your most sensitive metrics. In looking at this metric, we need to differentiate between a case being substantiated and it being valid.
Often when an employee takes the extraordinary step of reporting a matter, he or she does not report a single issue. In one report, an employee may report the following:
- Channel stuffing / revenue recognition
- Harassment by direct supervisor
- Person in next cube over is microwaving fish in the office
The way to think about this report is that an issue must be a violation of the law or the Code of Conduct to require an investigation. Therefore, while the third issue certainly is an affront to humanity, it does not require a formal investigation. If the first allegation is substantiated and the second is not, the entire case is still valid. If even one allegation which is a violation of the law or the Code of Conduct is substantiated, then the entire case is valid.
Navex puts the median substantiated rate at 43 percent; however, in my experience, the 30 to 35 percent range has proven to be reliable.
C. Anonymous
This metric is binary. You want fewer than 57 percent of your cases to be anonymous. The percentage of anonymous cases you have is an indication of people's trust of the system and the process. When you have people unwilling to provide their names, it could be an indication of a significant culture and transparency issue within the organization that will need focus and attention.
D. Number of Reports
The fourth metric relates to the number of reports you should be receiving in the system. Navex reports that the median is 1.4 reports per 100 employees. For the purposes of the table, I converted that ratio to 1:74. In order to get your metric, take your employee population and divide it by 74, which is the number of reports you want for the year. Divide that number by four and you will have the quarterly metric.
It is completely appropriate for a compliance officer to shift that number up or down based on their industry. For example, if you were in a highly regulated industry like healthcare, you may want to set an expectation of more reports and shift this to 1:68 reports.
E. Case Closure Rate
Nothing will kill a hotline faster than a lack of response. Therefore, it is important that the case closure rate is tracked. I recommend that 50 percent of cases be closed within 30 days and that 90 percent of cases be closed within 90 days. A case can be closed when it has been investigated, the report written, and the person in charge of investigations has agreed with the findings and proposed remedial actions as necessary.
III. Learning Cryptography
Now that we have all the metrics established, it is time to populate the chart with the data. Use the standard red and green, but avoid the dreaded yellow. It is better to shift a metric than to provide a milquetoast warning.
Each scorecard below displays all six metrics simultaneously. Green means on target; red means off target. The goal is to read the full picture — not just the outliers — because the combination of signals is what tells the real story.
A. The Wheels Come Off the Bus
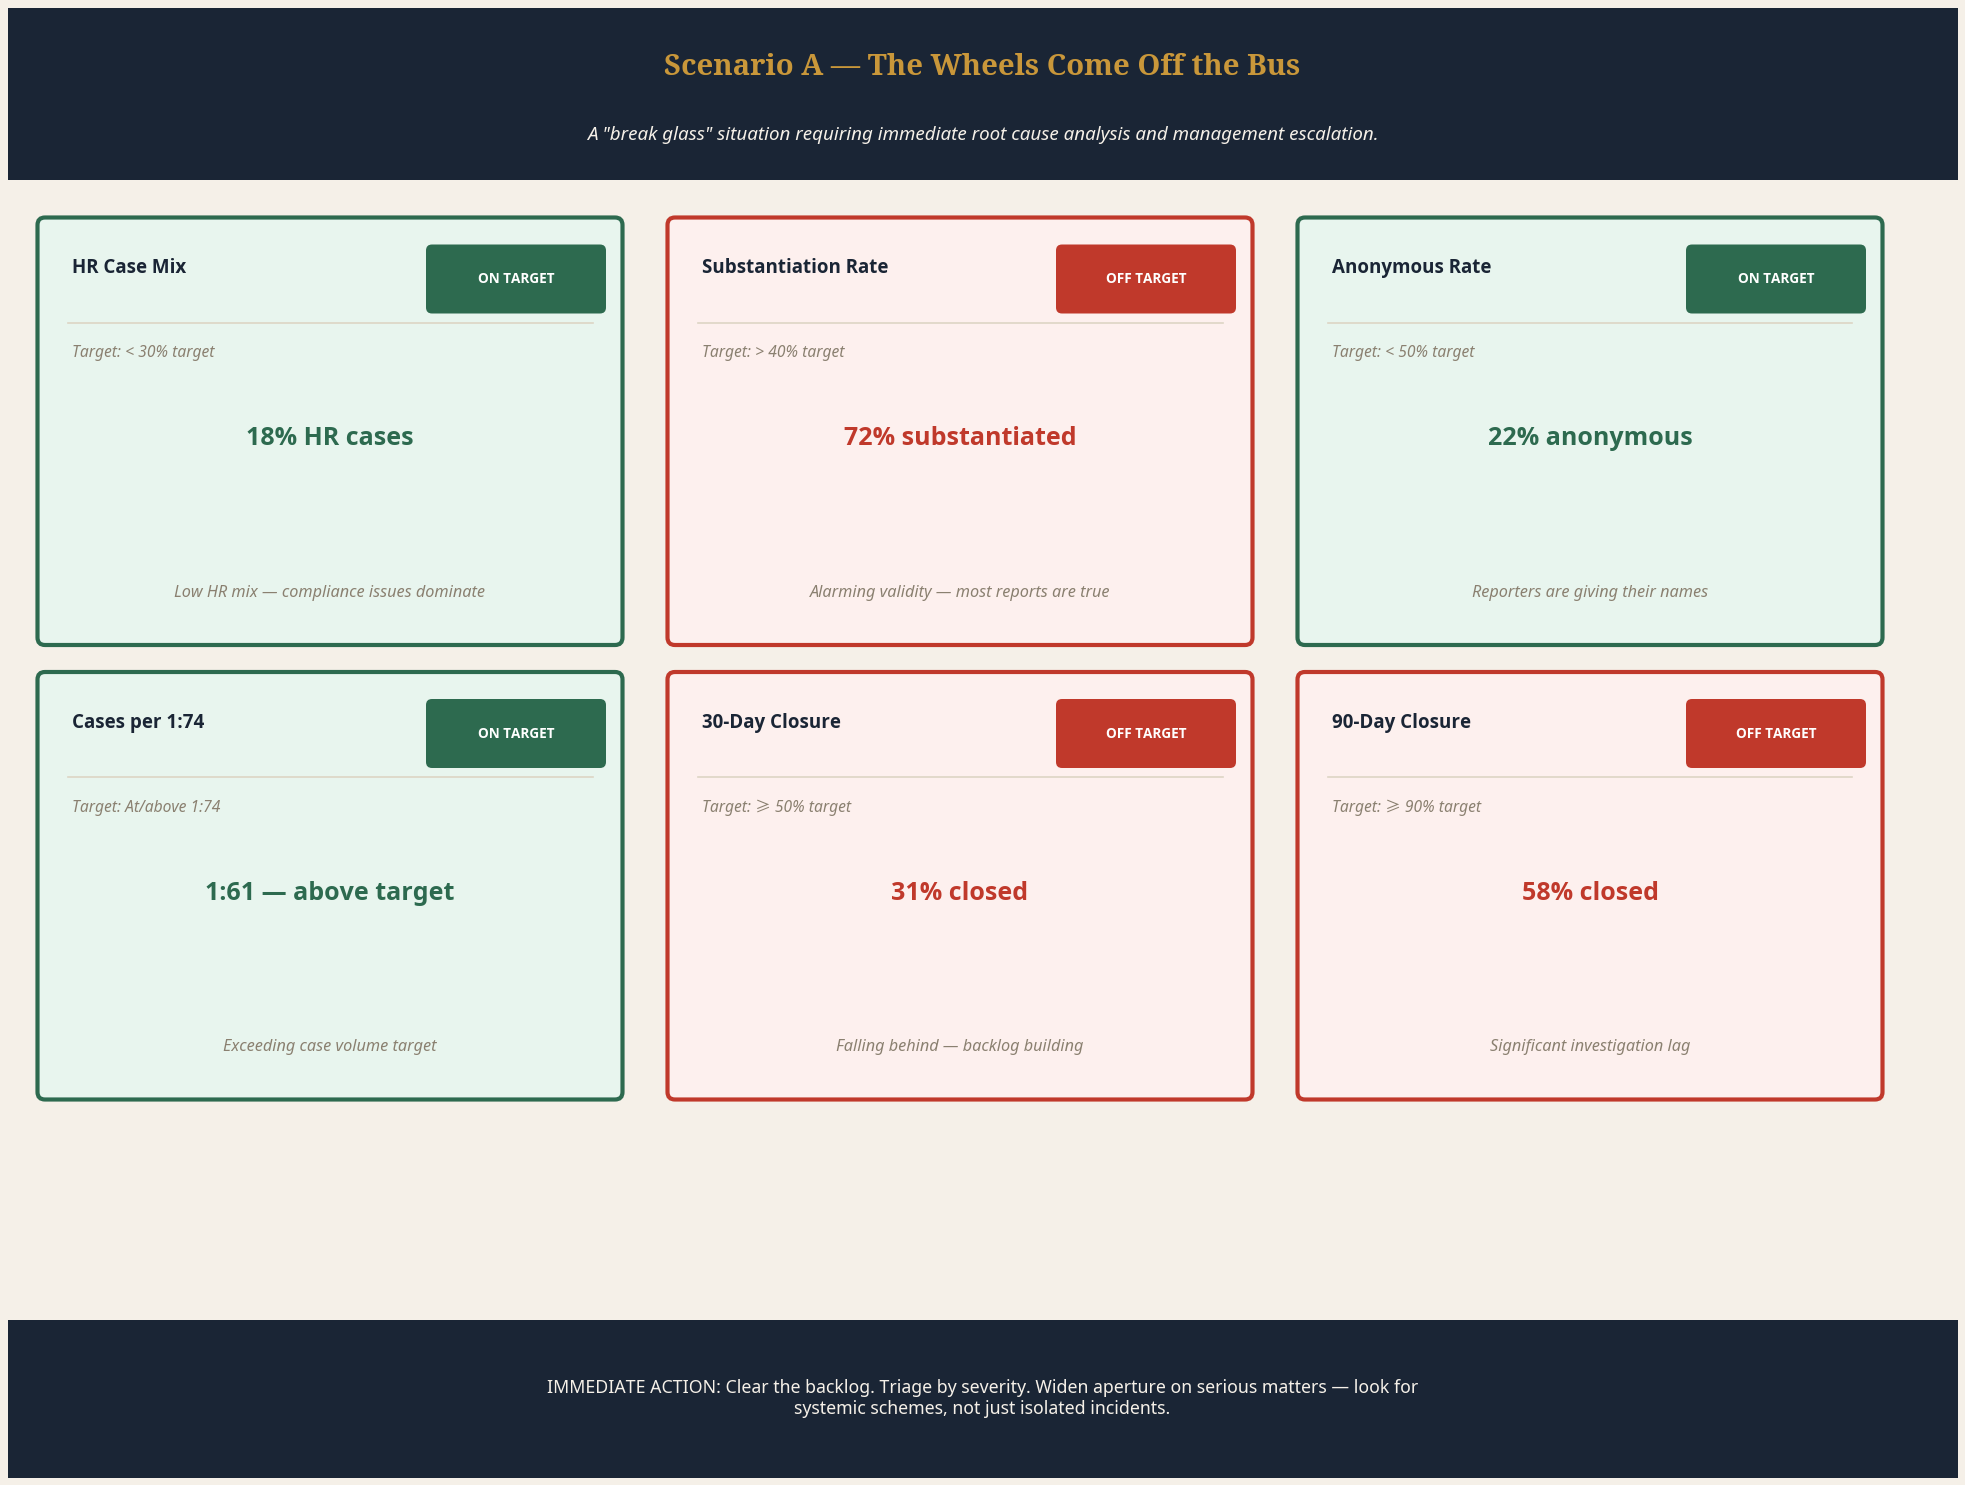
The way this should be read: compliance cases are dominating over HR cases, which is itself a warning sign. Validity is alarmingly high — the cases being reported are true at a disturbing rate. Reporters are giving their names, which means they feel safe enough to identify themselves. Volume is exceeding target. And the company is falling behind on closures at both the 30-day and 90-day marks. This is a program under acute stress. The compliance officer must escalate immediately and widen the aperture — this is not a collection of isolated incidents. Look for a systemic scheme.
B. False Flag
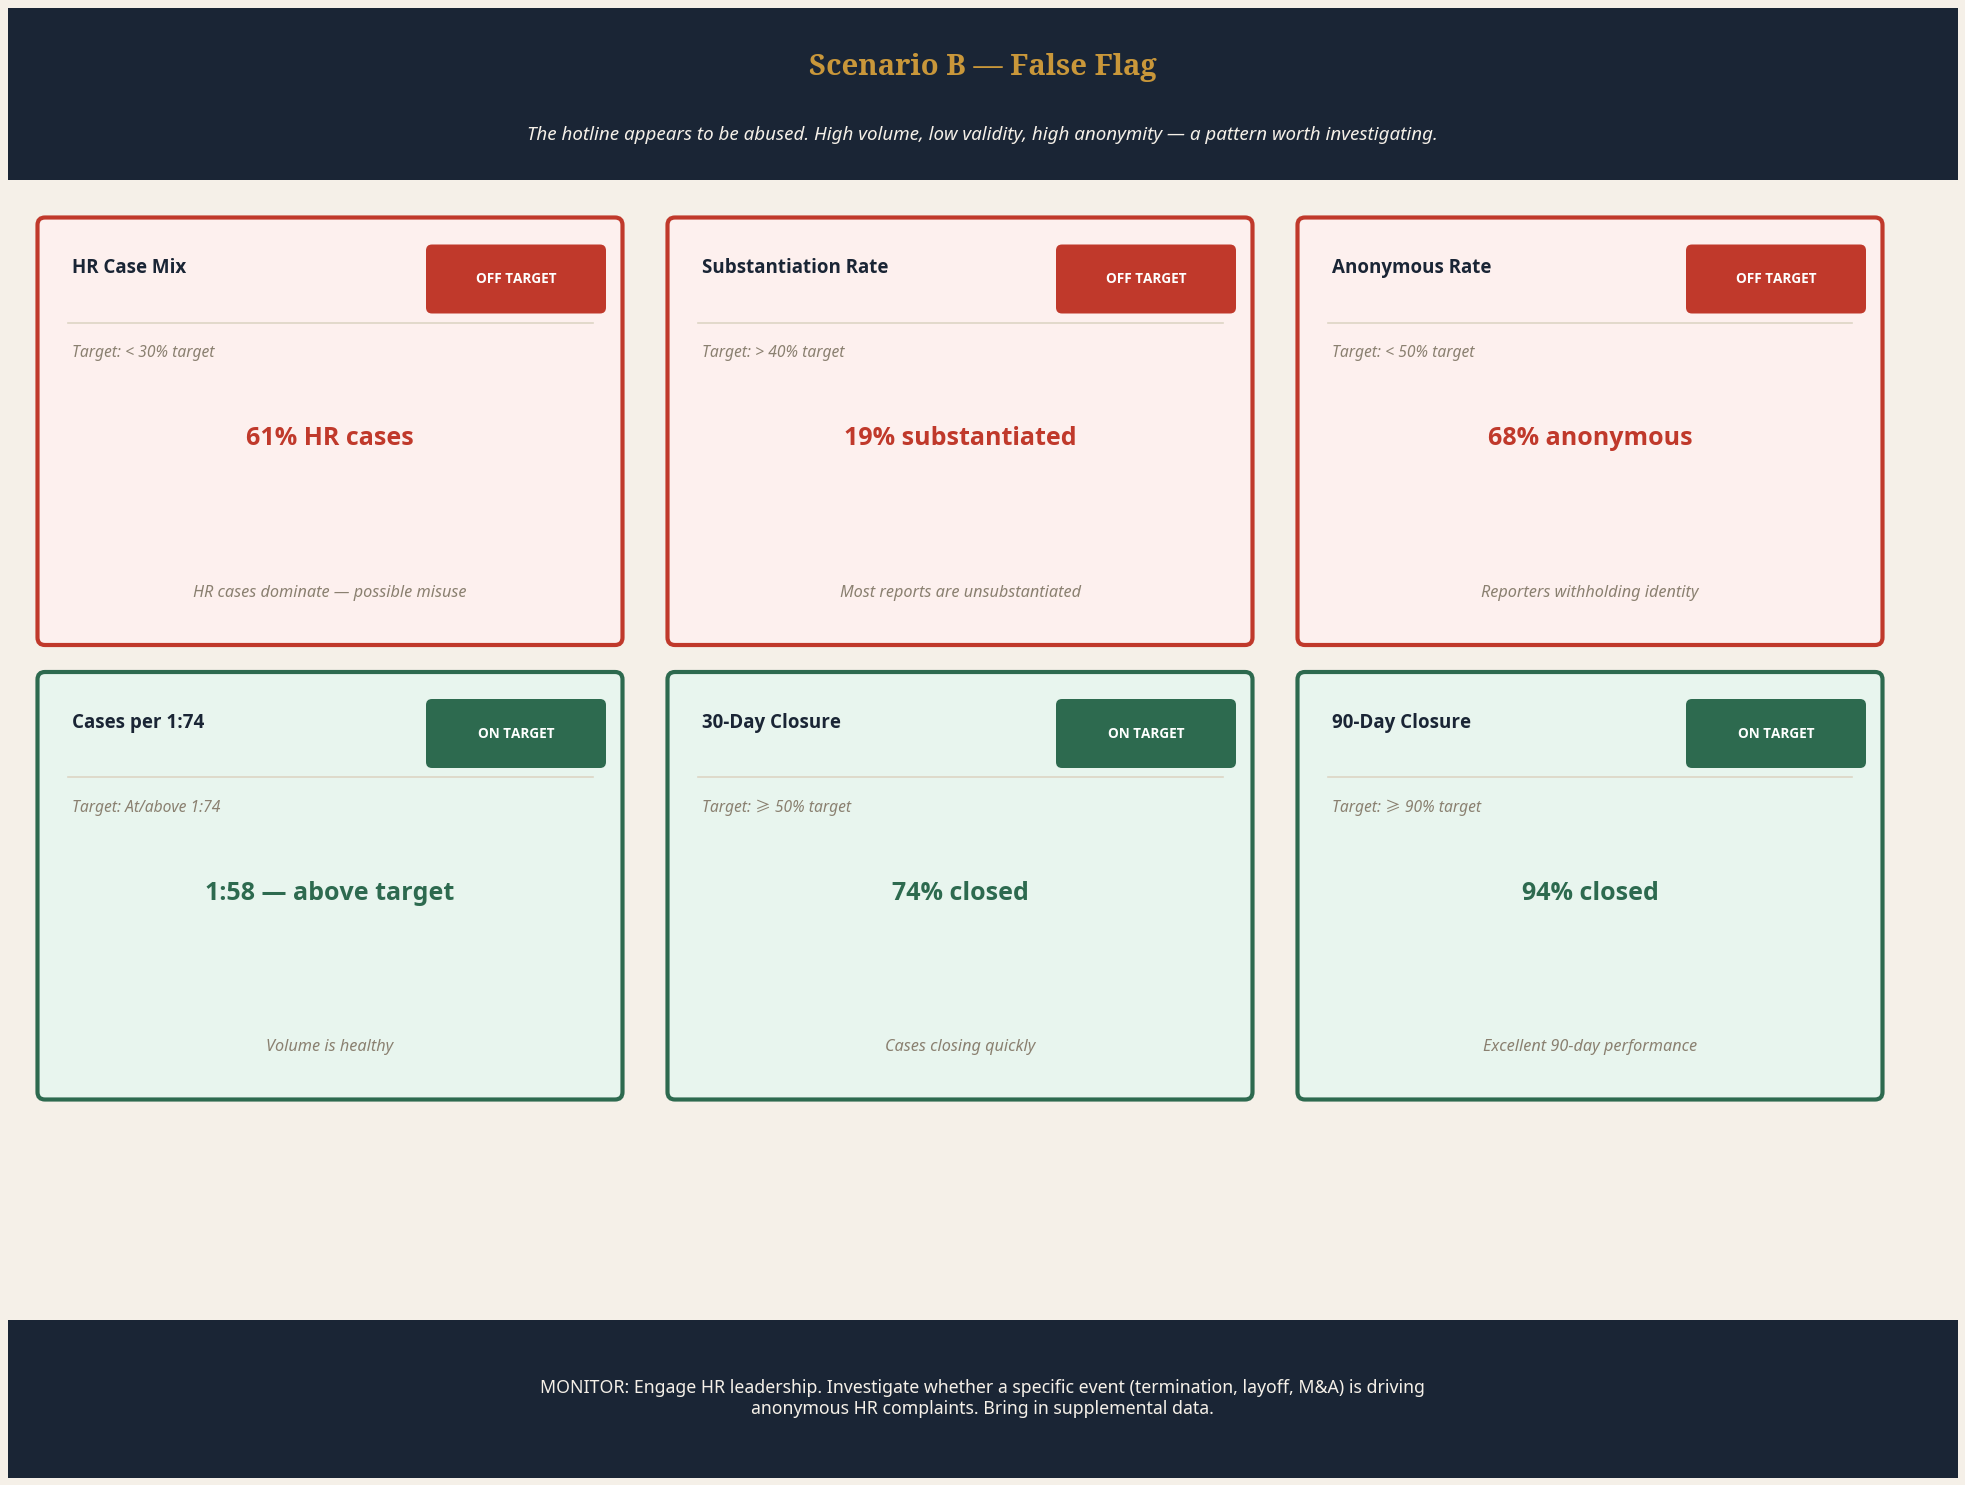
In this case, I would have a direct conversation with the head of HR. The combination of high HR case volume, low validity, and high anonymity is not random noise — it is a pattern. The question is what is driving it. Was a popular senior manager terminated? Was there a recent layoff, an unexpected outsourcing event, or a controversial M&A announcement? This situation is a strong candidate for bringing in supplemental data. The closure rates are excellent, which tells us the cases are being handled efficiently — but the intake pattern needs to be explained before the next reporting cycle.
C. We Aren't in Kansas Anymore
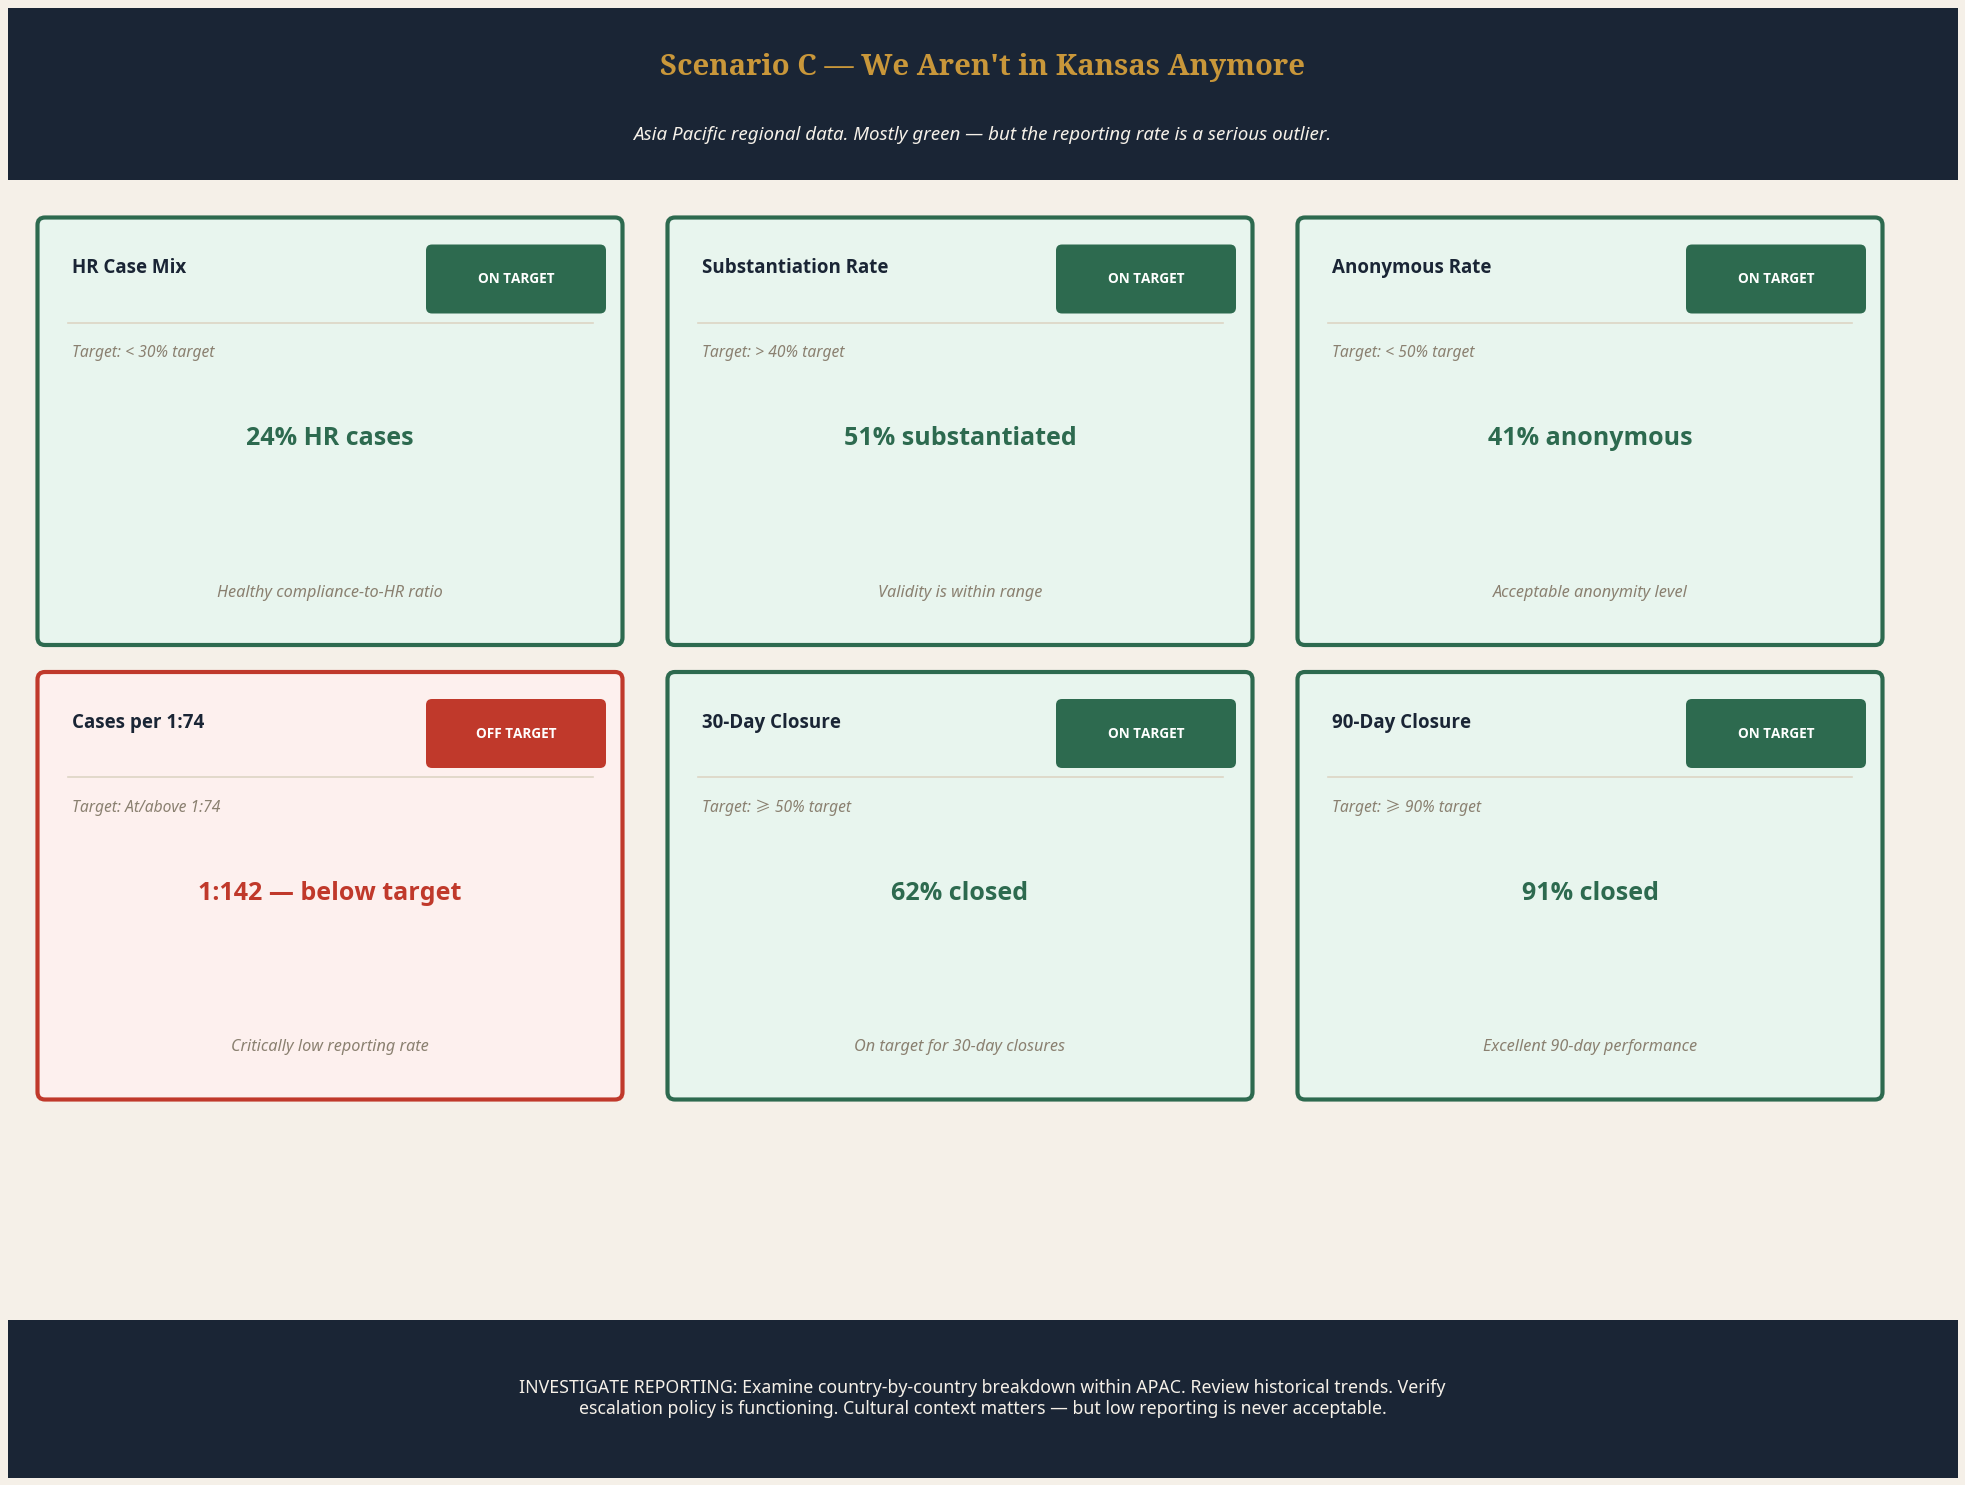
I made a small but very important alteration in this scenario — this now reflects just Asia Pacific's numbers. The overall picture looks healthy, and that is precisely the danger. A compliance officer who sees five green cards may be tempted to move on. Do not. The reporting rate of 1:142 means employees in this region are not using the hotline at anything close to the expected rate. I would want to do a deeper dive to understand the countries that make up APAC and how the employee population is distributed. I would also examine the historical data — has this group always been below target? That is not an excuse, but it will help put things in context. In addition, I would want to ensure that the escalation policy is working correctly and that all cases are being reported up the chain.
D. 'Tis the Season
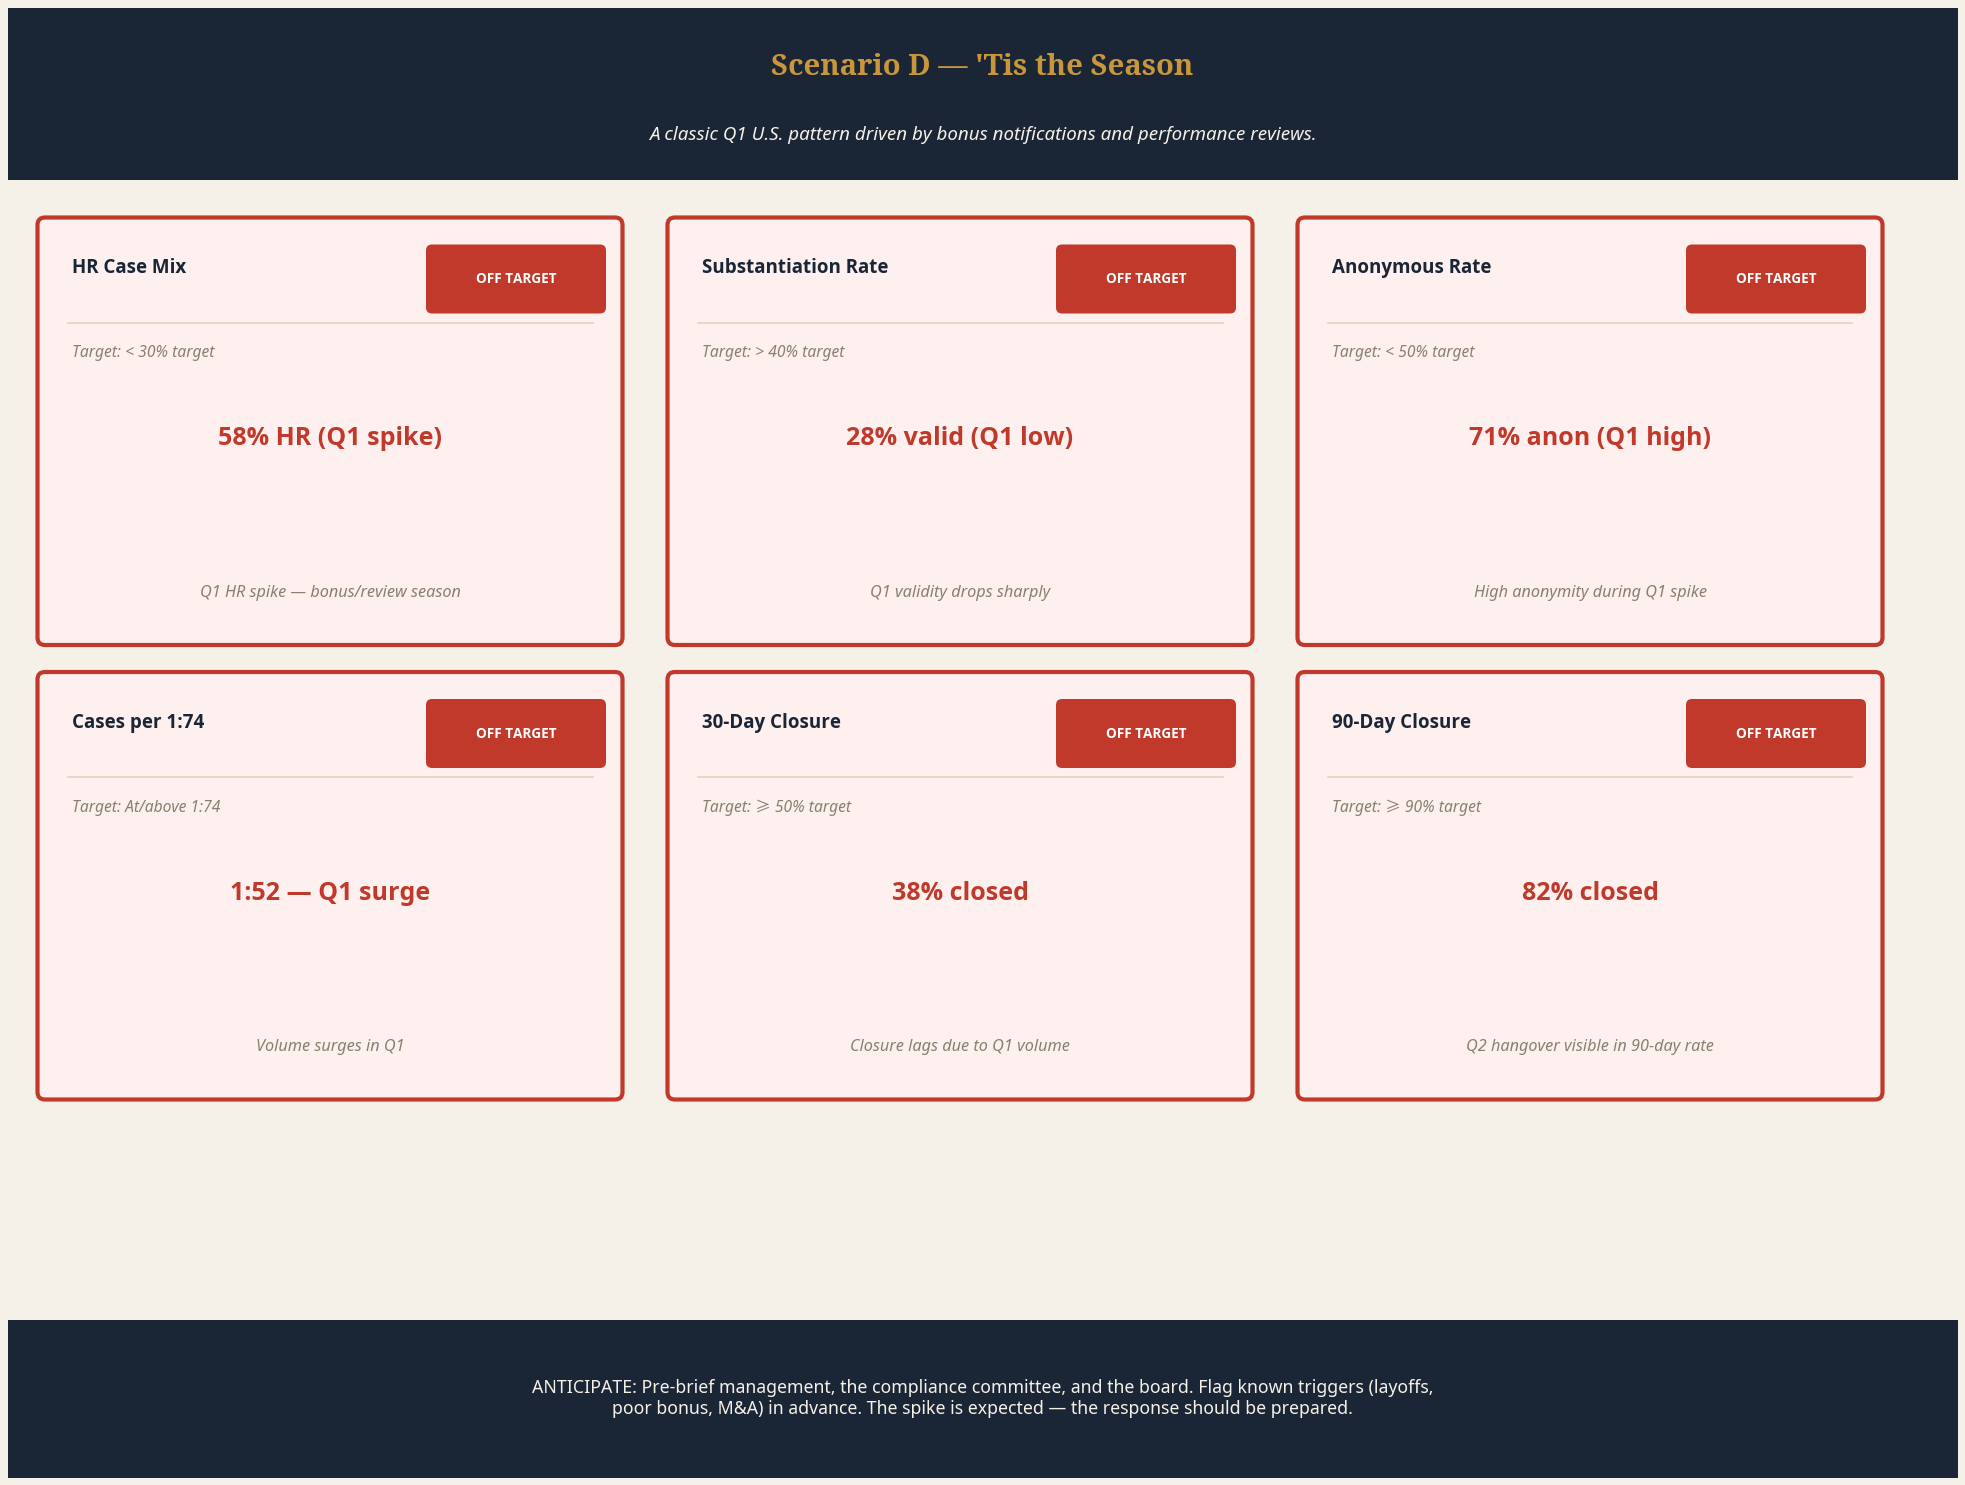
This is a classic Q1 chart for the United States. Reviews and bonus notifications occur in Q1 at most companies. That does not discount the signal, but it provides a good reason for the spike and the corresponding data. The HR case mix surges, validity drops, anonymity rises, volume spikes, and closure rates lag with a hangover into Q2. A data-sensitive compliance officer should prepare management, the compliance committee, and the board to see patterns like this during major events — not explain them after the fact.
"A data-sensitive compliance officer should prepare management, the compliance committee and the board to see spikes like this during major events."
Compliance staff should anticipate these issues and flag them in advance when, for example, they know the company is going to have a major round of layoffs, the bonus payout will be very poor, there is significant unexpected outsourcing, or there will be controversial M&A activity. The spike is expected — the response should be prepared.
E. Taking Your Lumps
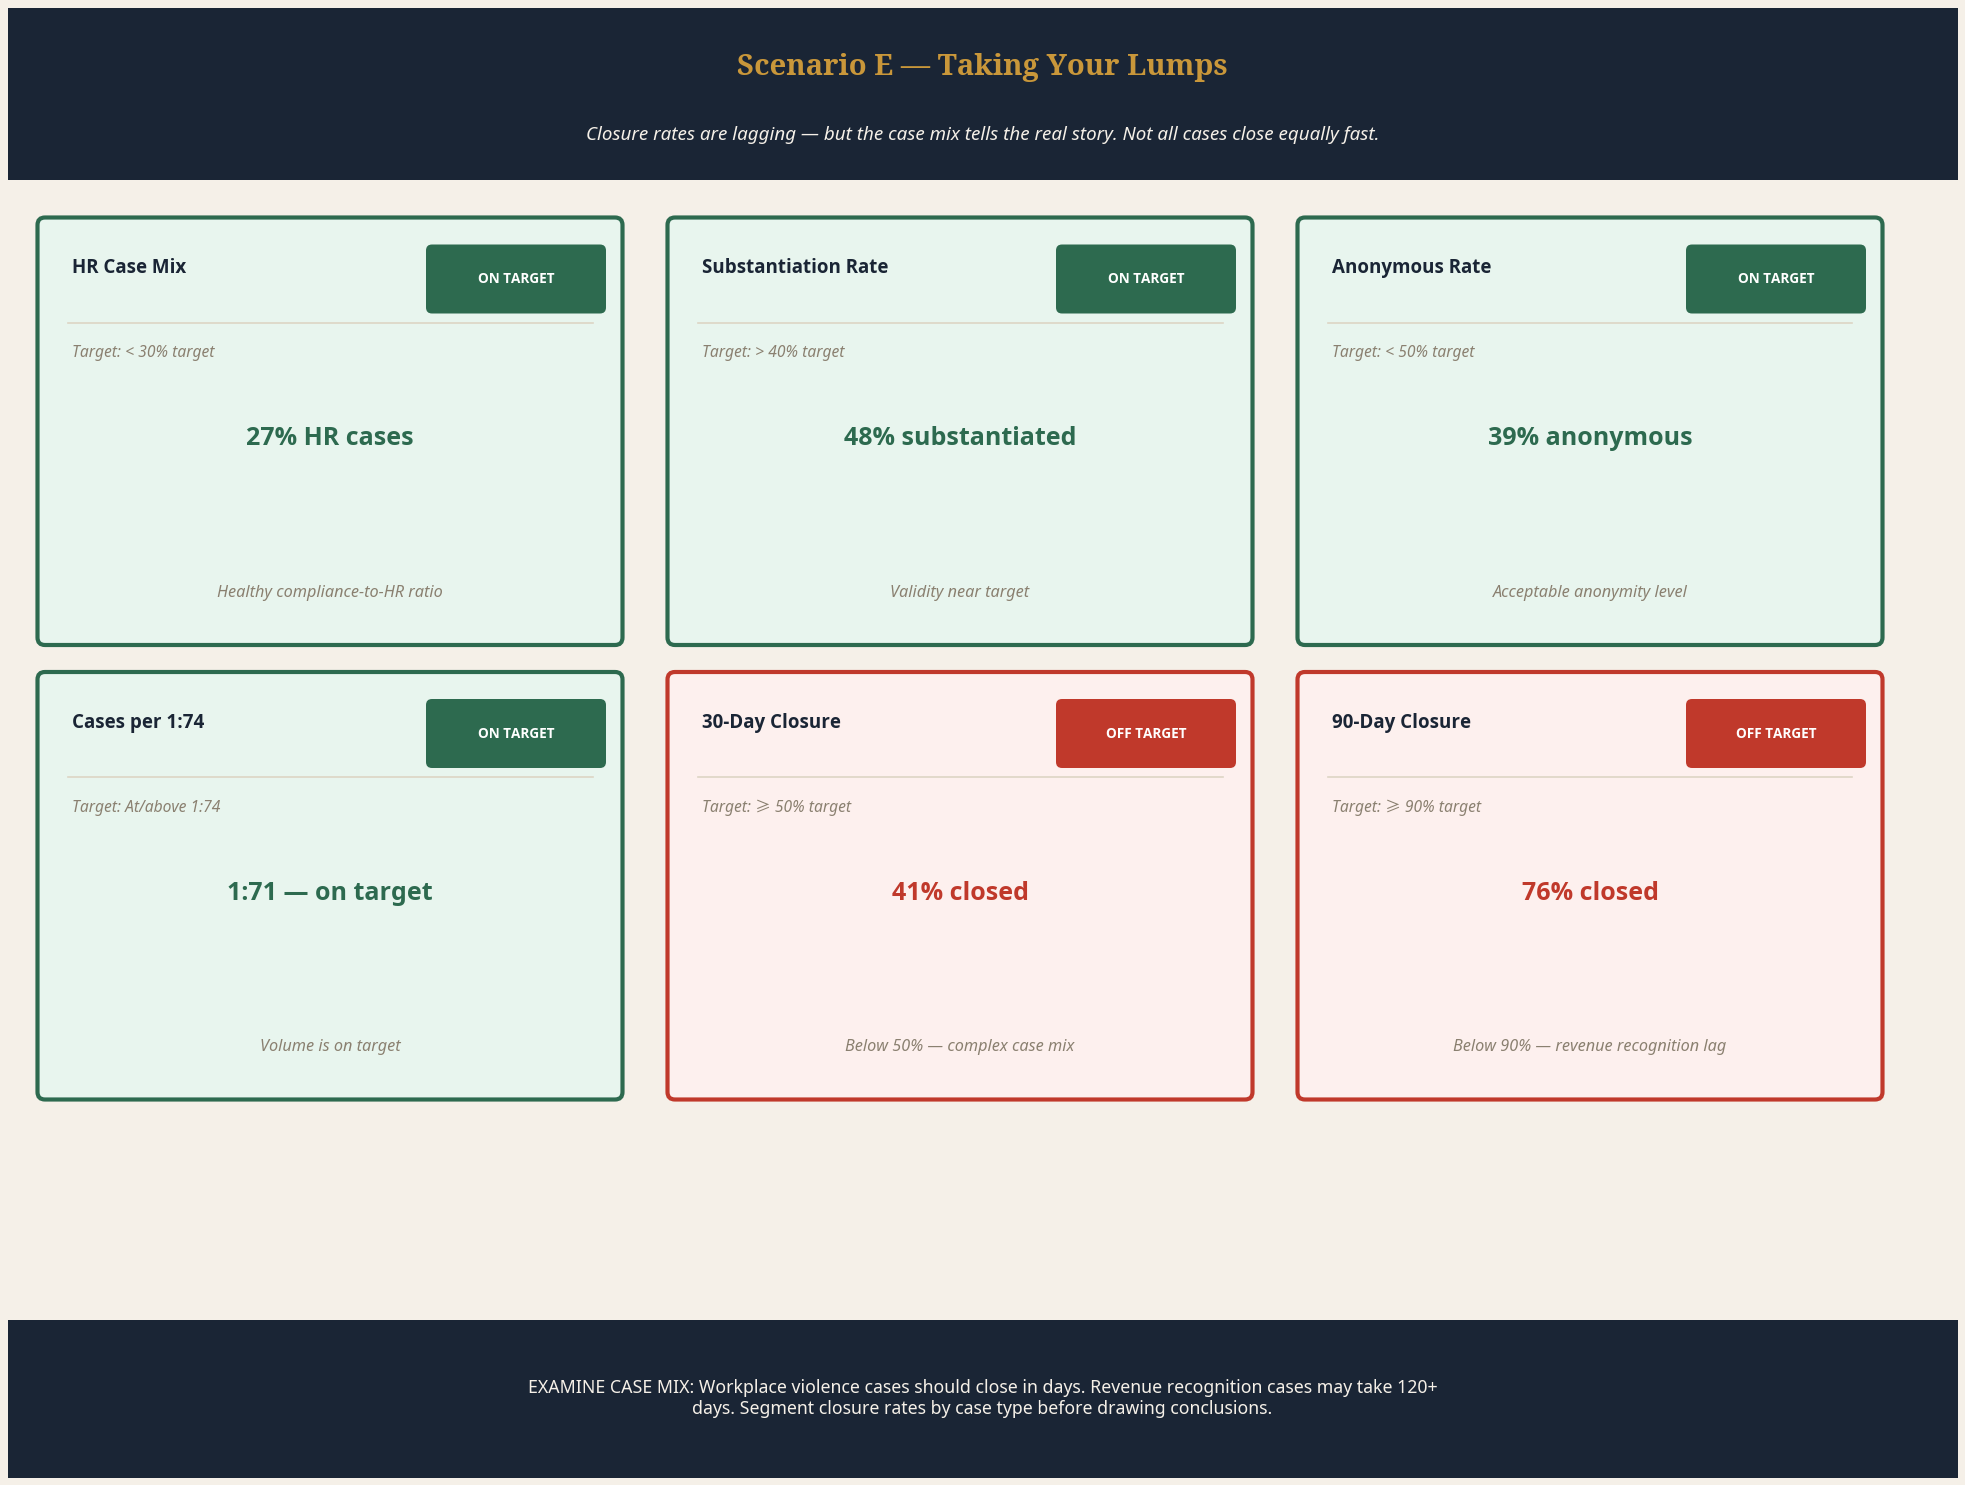
In considering the case closure rate, it needs to be understood that not all cases are created equal. A workplace violence case needs to be handled very quickly, whereas it will often be difficult to close a revenue recognition case in less than 120 days. Therefore, when looking at the reports, you should counsel the team to look at each case type individually before sounding the alarm. Many companies have gone so far as to set targets for closure rates for each case type. In my experience, that individual target setting is very difficult to sustain, so I prefer to stick with the overall targets and then examine the case mix if there is a drift into the red.
F. Can You Hear Me Now?
There has been a noticeable trend in the sources of cases over the last few years. Actual phone calls are making up a smaller and smaller percentage of the total. Many compliance officers note that they are getting plenty of cases but that the actual hotlines are going silent.
I attribute this to the fact that all of us feel more and more comfortable at our keyboards. There are web forms where reporters can take their time and capture everything they want to say. It is not uncommon for me to open a report that is a veritable treatise on everything the reporter feels is wrong within a company. Bottom line, this should not be an area of focus or stress. As long as the total number of cases are hitting the target, the sources are less important.
G. A Thousand Points of Light
We are focused on this statistical model, but there is other data that can help inform our assumptions. Whenever we look at disparate data points that were collected using different methodology, we need to ensure that we do not confuse correlation with causation. For example, when there are more ants, more Coca-Cola is consumed. They are correlated; however, they are not causal. The link is that when it is hot, there are more ants and more Cokes.
One particularly good data point is the engagement survey, which goes by the nom de guerre of Pulse Survey or simply Employee Survey at different companies. Pairing this data with hotline data can often help explain why a particular group is unhappy.
Other data points to consider:
- Employee turnover rate
- Number and length of time open of job requisitions
- Sales goals and attainment
- Bonus payout data
- Audit reports
- Historical hotline data
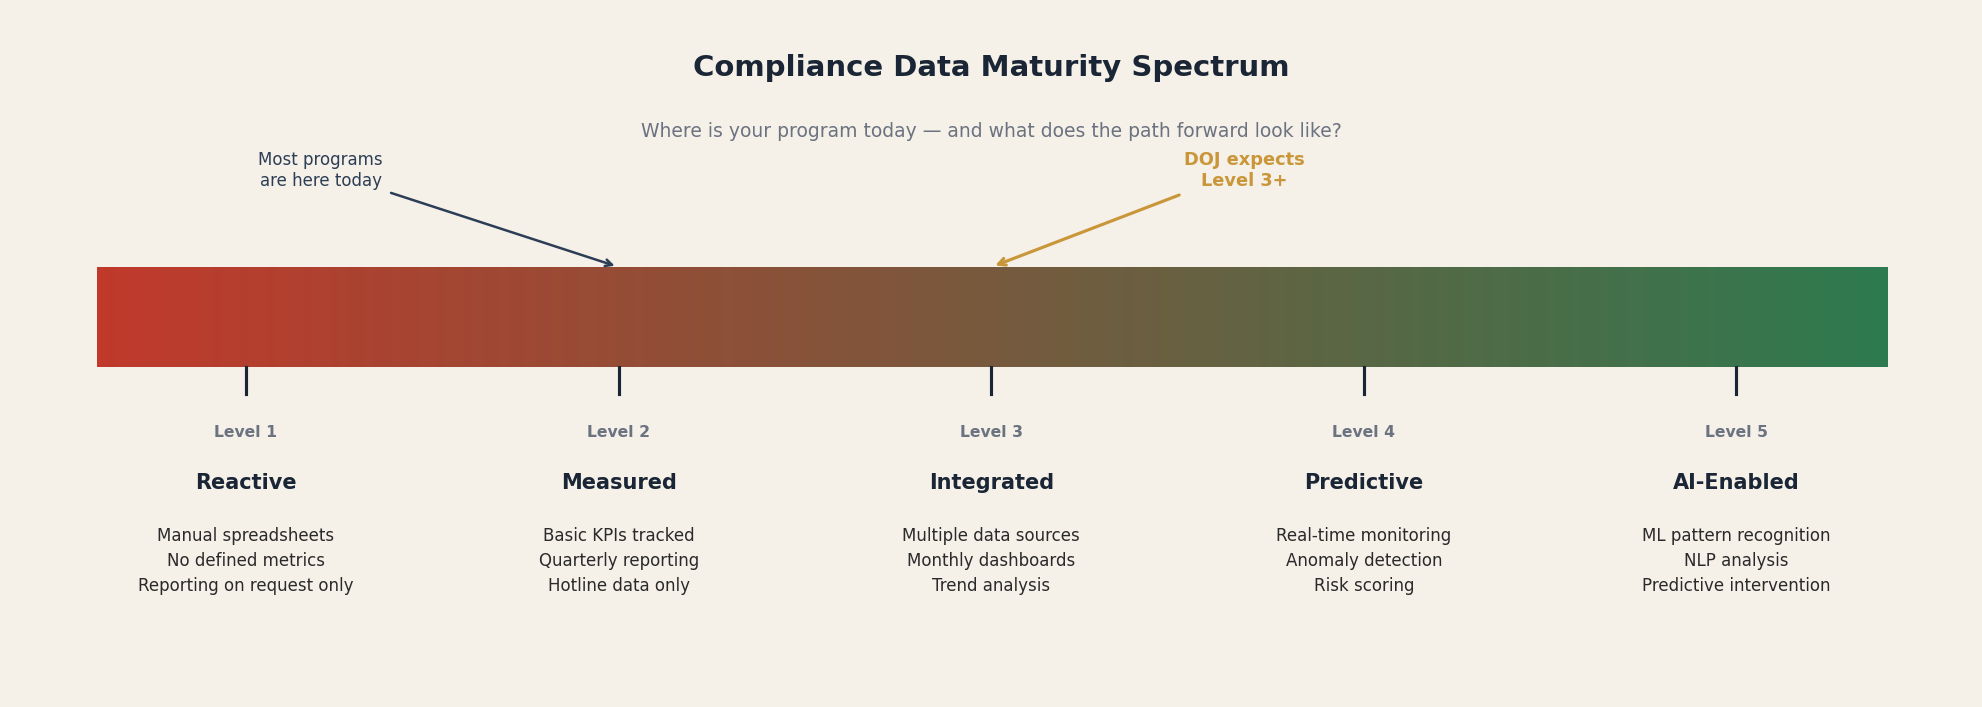
This type of integrated data analysis is exactly what the DOJ is looking for in evaluating the compliance program's level of sophistication. Understanding all the data warehouses, data lakes, and available information will assist you in selecting the right tool for the right project.
IV. This Is Not the End
This statistical matrix will not work for everyone, but it is a start. If you are a relatively small company and only get a few reports a year, it will be difficult to come to any solid conclusions, because any one case could skew your conclusions. In my experience, this matrix will not work until you have at least 100 reports a year.
In addition, each compliance officer needs to understand where his or her company is currently in the compliance journey. It makes no sense to implement this statistical framework if it will result in a sea of red. You should adjust the matrix as necessary to make it rigorous, but there needs to be a chance at "green" to keep the business motivated. You can continue to refer to this grid and discuss with your constituents what the final goal is and why. I believe the closer you can move to the standards in this chart, the better your overall program and hotline will perform.
The data wave is not cresting, but instead has already crashed ashore. It is up to each compliance person to determine how best to harness the information and paint a picture for the business to show how it is performing and what lies ahead. The DOJ has indicated that it expects modern compliance officers to use data in their programs. Hopefully this statistical model can help enhance your relationship with your new best friend — data.
This article is intended for informational purposes only and does not constitute legal advice. For guidance specific to your organization's compliance program, consult qualified legal counsel.